Quantum-Si (QSI) stock
Pro members see every stock ranked and every check behind each score, live.
Why QSI is up
Quantum-Si rose 33.6% on Oct 1.
Measuring & Controlling Devices stocks rose a median 1.6% and the S&P 500 rose 0.2% that day; Quantum-Si rose 33.6%.
1 more driver and the timeline, for Pro members
Why QSI scores 0
Below AverageTrending down, 6 of 14 checks firingWhat the Quality Score means
- +6Chart checks 6 of 14 firing right now, one point each
- −3Insider trades The CEO is selling into the 52-week low: Jeffrey Alan Hawkins (President & CEO) sold $7K on Sep 22, and 5 more filings
- Long-term trend adds
- Run-up adds
- Profit subtracts
- Growth subtracts
- Dilution subtracts
- Volatility subtracts
- Cash flow subtracts
What's next
Wed Oct 14: Quantum-Si Incorporated Proteus roadshowIndustry event · date confirmed.
Expected to report Thu Nov 5, after the close
3 more dates ahead for Pro members: conferences
What would turn QSI's score around: 8 things, for Pro members
Here is what Pro members see.
Every stock has a live page like this, QSI included: the price in real time, the full chart, all 14 checks, and every line of its score.
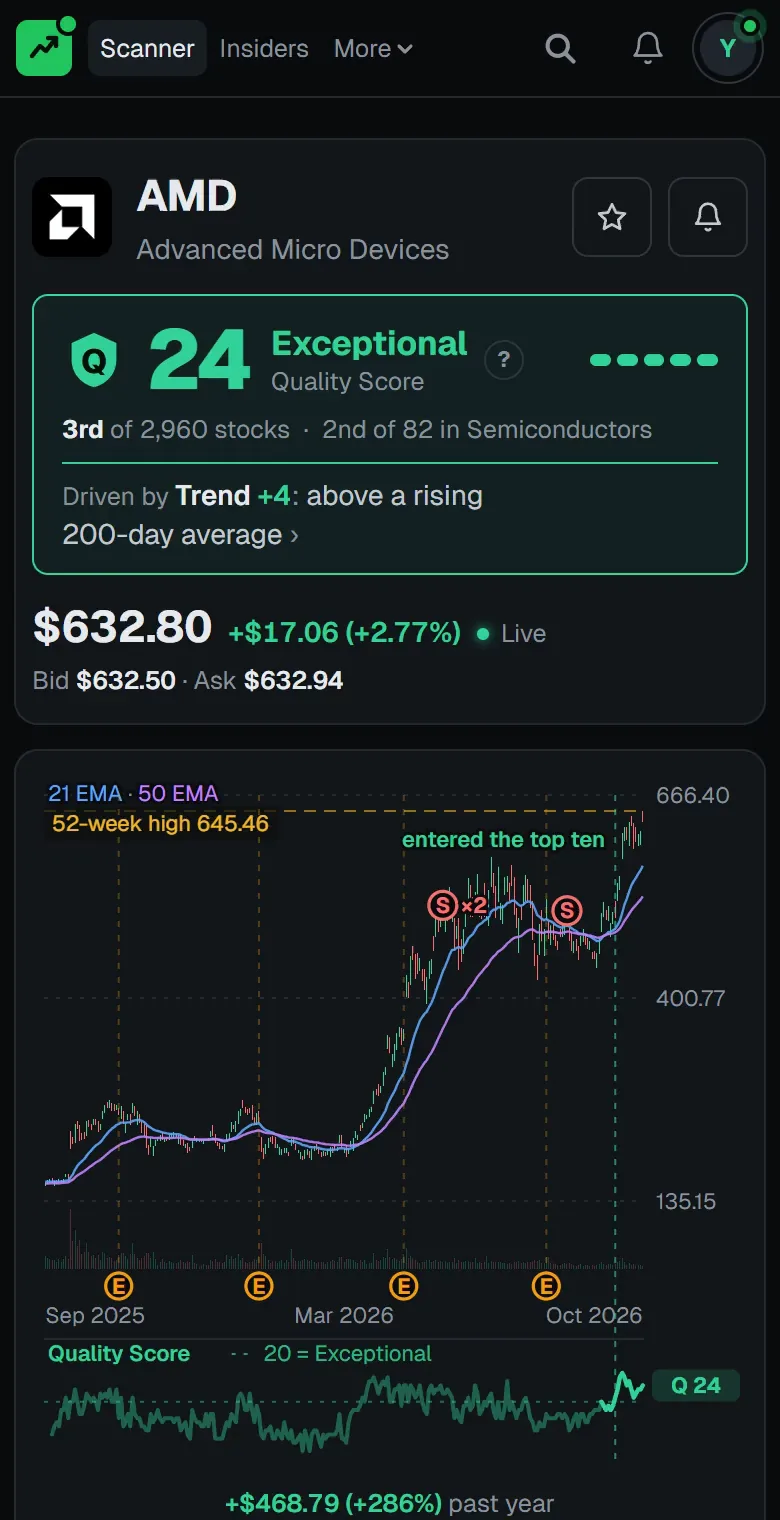


- Prices refresh every 2.5 seconds during market hours.
- Optional alerts by push, email, or the bell.
- Add it to your Home Screen and it opens like an app.
QSI has 6 of 14 checks firing
One per group is shown here.
Also on the chart
- RSI 1487.5
- MACD (12, 26, 9)Above signal
- 50-day average$0.81
- 200-day average$0.95
- ADX 1436.6
- Support$1.26
- Resistance$3.10
- Volume3.9x
How QSI ranks in Measuring Devices
QSI is #5 of 6 by Quality Score among Measuring & Controlling Devices. The top three are shown with their scores, and more by name.
TMO5/1415
ONTO7/1413
ROK7/1411
MIROpen for its score
QSI6/140
When does QSI report earnings, and what happens after?
Expected to report Thu Nov 5, after the close (in 34 days). Not yet confirmed by the company.
Who is trading QSI
QSI insider trades
4 insiders sold $111K across 14 filings in the last 6 months. No open-market buys on record. The newest:
About Quantum-Si
Quantum-Si Inc is a life sciences company focused on proteomics research and analytical technologies. It develops single-molecule detection platforms designed to enable next-generation protein sequencing (NGPS) and large-scale protein analysis. Its technology supports massively parallel sequencing of proteins and can also be applied to the study of nucleic acids, providing tools for researchers and clinical applications in molecular analysis. The company's revenue is derived from sales of products and services.
Every line of the score, on every stock.
- Real-time prices, no delay
- Every line of QSI's score, with the points and the reason
- All 14 checks on QSI and on all 3,243 stocks
- Every stock ranked, with the chart
- Every filing, and optional alerts on QSI
Straight Answers.
Are the prices delayed?
Only on the public pages, which run at least 15 minutes behind. Pro members, trial included, see real-time prices: the scanner refreshes every 15 seconds, and your watchlist every few seconds, pre-market and after hours included.
Where does the data come from?
Daily bars, quotes, reference data, headlines, and short interest come from Massive, formerly Polygon, a licensed market data vendor. The age of the quotes is shown at the top of every page. Insider trades, notable holders and profits come straight from the SEC. That means Form 4 filings, 13F filings and XBRL financial data on EDGAR. Government filings come from the public STOCK Act and Office of Government Ethics disclosures. The market-wide headlines on the market line also come from the public headline feeds CNBC, MarketWatch and Yahoo Finance publish, shown as the headline, the source and a link to the article. Splits, dividends, and the financial statements on each ticker page come from the vendor's reference data. The 8-K filings on EDGAR are read for the items that move a price. Five years of history is loaded for every stock. So the 200-day and 52-week checks rest on real history. Options flow is not part of the product.
Do I need an account?
Not for the first 24 hours. Tap any green button and you're in, with no email and no password. To keep going, create a free account with Google, Apple, or your email. There is no password to make up.
Is this investment advice?
No. It is a screening tool that scores stocks on the chart, the company's own results, and the news and filings. It does not know your situation and it is not a recommendation to buy or sell anything. Please do your own research.