Insider trading, January 2026
We do the work for you. Every stock is scored and ranked, every 15 seconds while the market is open. Here it's 15 minutes behind. Pro members see it live.
See all 537 insider trades in 30 daysSee it live, free until Wednesday morning. No account. No card. Then keep going with a free account.
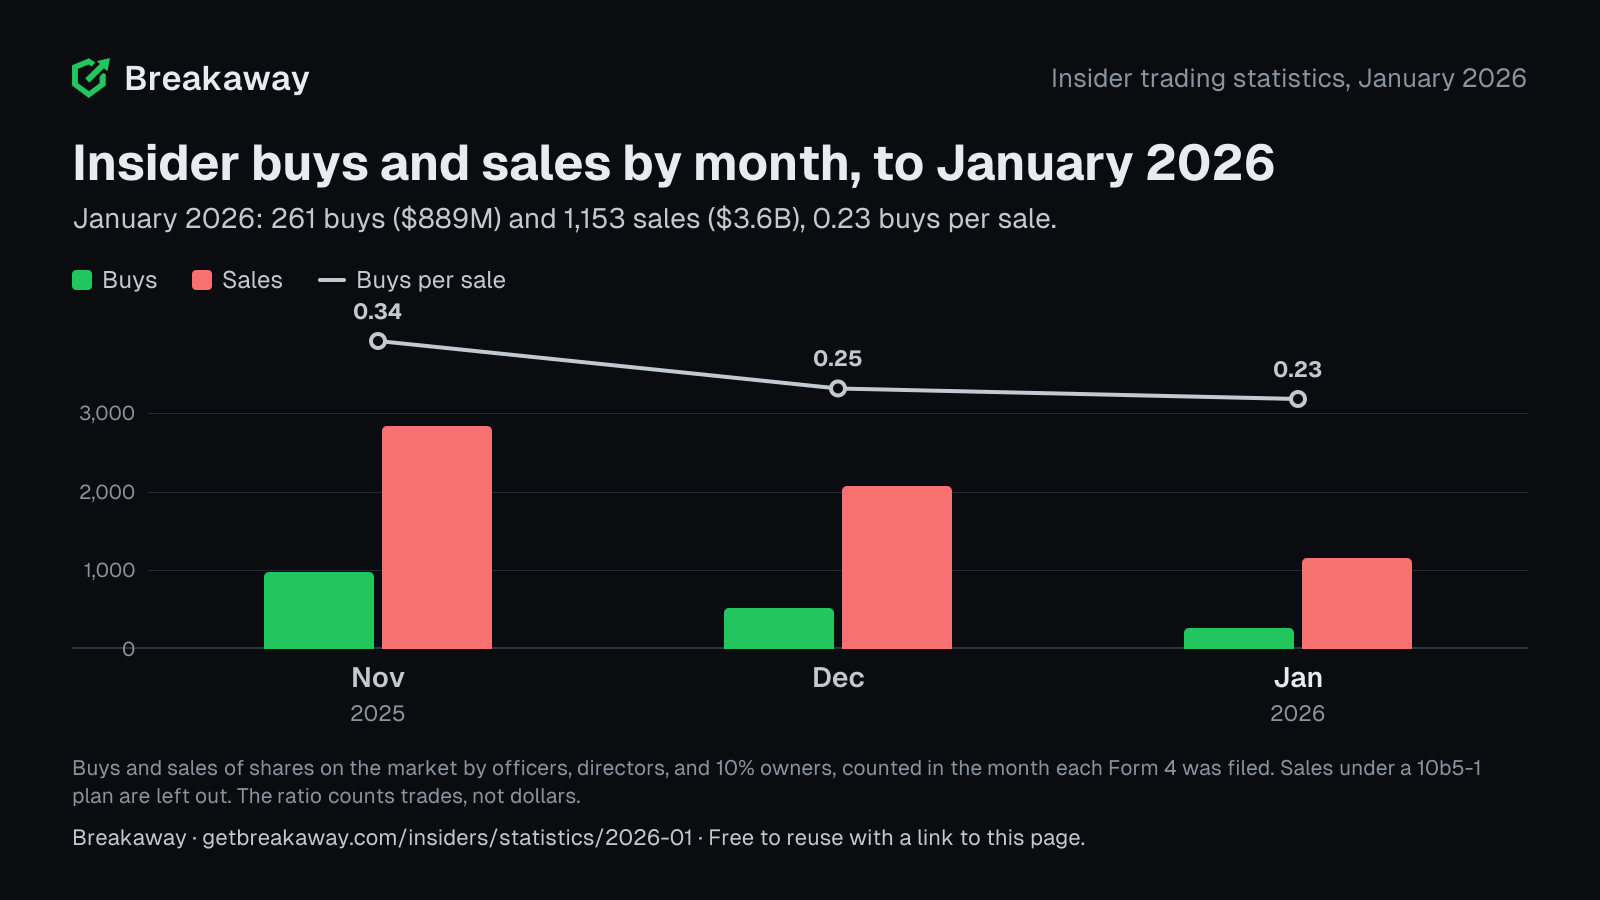
Month by month
| Month | Bought | Sold | Ratio |
|---|---|---|---|
| Jan 2026January 2026 | $889M | $3.6B | 0.23 |
| Dec 2025December 2025 | $1.1B | $7.6B | 0.25 |
| Nov 2025November 2025 | $713M | $16B | 0.34 |
We do the work for you. Every stock is scored and ranked, every 15 seconds while the market is open. Here it's 15 minutes behind. Pro members see it live.
See all 537 insider trades in 30 daysSee it live, free until Wednesday morning. No account. No card. Then keep going with a free account.
By role
| Role | Bought | Sold |
|---|---|---|
| CEOs | $30.7M | $210M |
| CFOs | $900K | $87M |
| Directors | $80M | $411M |
| 10% owners | $776M | $2.6B |
| Other officers | $584K | $249M |
| Other filers | $358K | $24.7M |
The 10 largest buys
1 more Quality Score, for Pro members. See them free →
The 10 largest sales
4 more Quality Scores, for Pro members. See them free →
How these figures are made
- Shares bought or sold on the market. The buys and sales officers, directors, and 10% owners filed on Form 4s, never grants, option exercises, gifts, or shares held back for taxes.
- Plan sales left out. Sales a Form 4 marks as made under a 10b5-1 trading plan set up in advance are not counted, as the Insiders list leaves them out. Buys so marked are counted, as the list counts them, and tagged Plan.
- By the filing date. A trade counts in the month its Form 4 was filed, the day the public could read it.
- One trade, once. A trade reported by more than one owner of the same shares (a fund and its general partner) counts once. A move between two filers on one day at one price, and a price in another currency or share unit, are left out.
- Dollars as filed. Shares times the price on the filing. The buy/sell ratio counts trades, not dollars. The record reaches back to trades made on Oct 7, 2025.
Use these statistics
How to cite
Breakaway, Insider Trading Statistics, January 2026, Feb 1, 2026, getbreakaway.com/insiders/statistics/2026-01
Journalists: email [email protected] for the data behind this page.