IPOs, Q2 2026
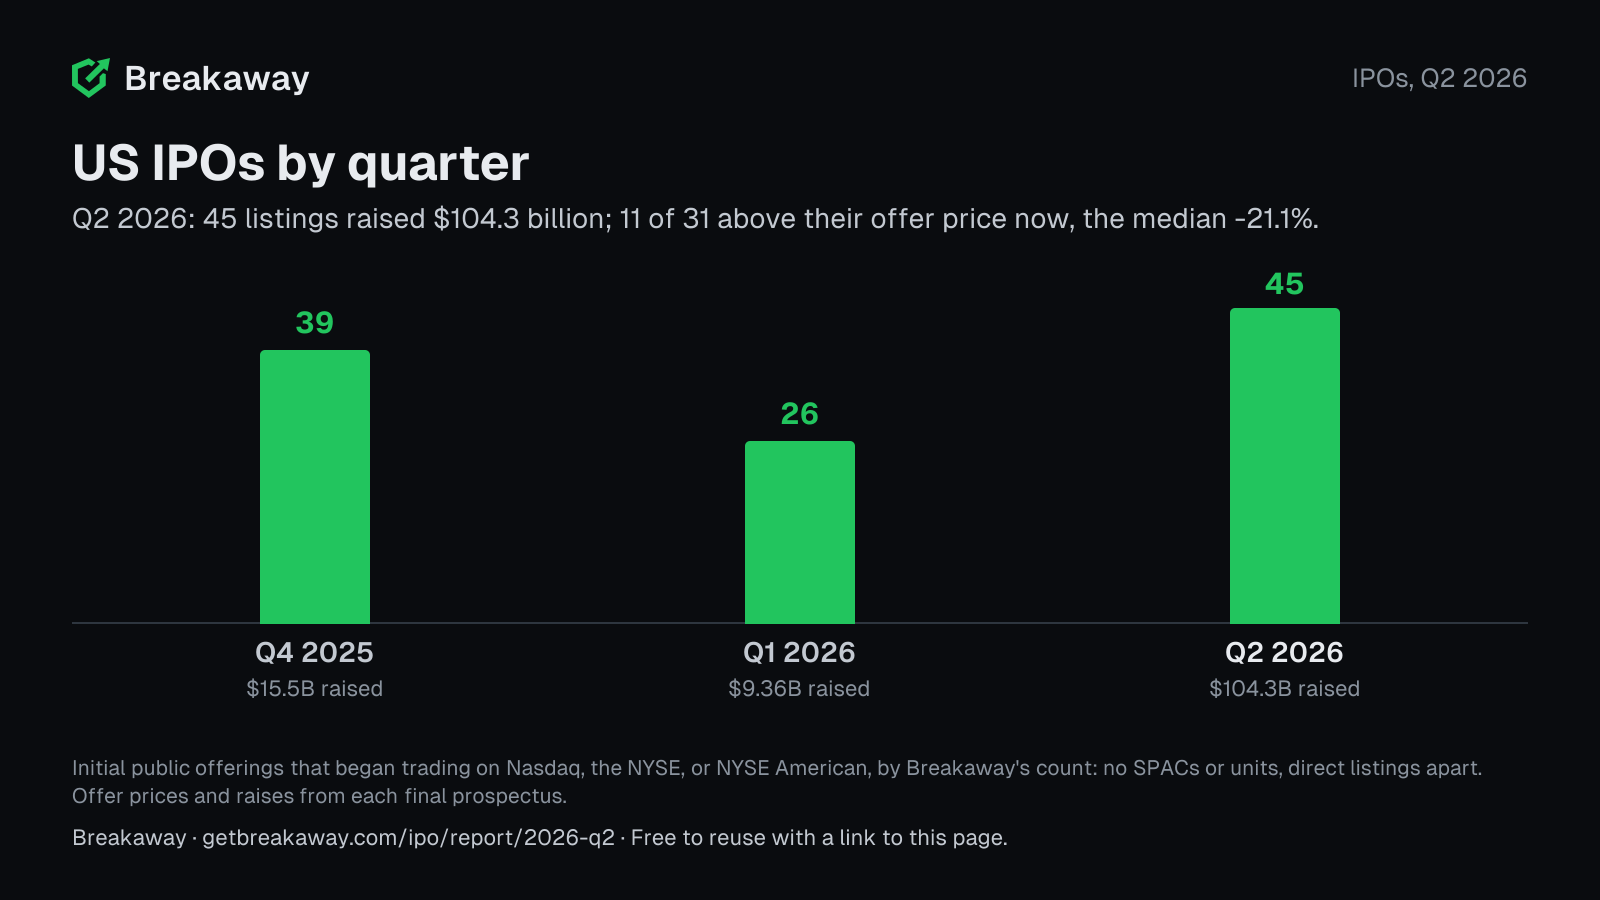
45 companies listed in Q2 2026 and raised $104.3 billion. 11 of the 31 in Breakaway's scan trade above their offer price now; the median is -21.1% from its offer. Of the 43 with a first day on record, the median first-day move was +12.6%, from the offer price to the first close.
We do the work for you. Every stock is scored and ranked, every 15 seconds while the market is open. Here it's 15 minutes behind. Pro members see it live.
How the class has traded
- The first day. 28 of 43 closed their first session above the offer price, and 11 below; the median move was +12.6%.
- Since. 11 of 31 trade above their offer price now; the median is -21.1% from its offer.
The highest from their offer price
- Hemab Therapeutics is 100% above its $18 offer price+100.1%
- Arxis is 88% above its $28 offer price+88.3%
- Alamar Biosciences is 79% above its $17 offer price+78.8%
The lowest from their offer price
- AIAI is 91% below its $20 offer price-90.5%
- Deep Fission is 87% below its $16 offer price-86.5%
- Fervo Energy is 70% below its $27 offer price-70.5%
We do the work for you. Every stock is scored and ranked, every 15 seconds while the market is open. Here it's 15 minutes behind. Pro members see it live.
Every listing of Q2 2026
| Stock | Since | Quality Score |
|---|---|---|
| – | ||
| -22.7% | ||
| – | ||
| -21.1% | ||
| – | ||
| +8.8% | ||
| – | ||
| +25.1% | ||
| -60.7% | ||
| – | ||
| -38.4% | ||
| -37.5% | ||
| -27.2% | ||
| -3.0% | ||
| -48.6% | ||
| -86.5% | ||
| -26.5% | ||
| +17.2% | ||
| – | ||
| -41.4% | ||
| -19.1% | ||
| +6.3% | ||
| -70.5% | ||
| -27.9% | ||
| – | ||
| -90.5% | ||
| – | ||
| – | ||
| -50.9% | ||
| – | ||
| – | ||
| +100.1% | ||
| – | ||
| +50.8% | ||
| – | ||
| -53.5% | ||
| +56.0% | ||
| +27.3% | ||
| +24.8% | ||
| -20.2% | ||
| -46.6% | ||
| +78.8% | ||
| -15.1% | ||
| +88.3% | ||
| – |
The biggest raises
| Company | Raised | Offer |
|---|---|---|
| Space Exploration Technologies | $75.0B | $135 |
| Cerebras Systems | $5.55B | $185 |
| Innio | $2.43B | $27 |
| Madison Air Solutions | $2.23B | $27 |
| Fervo Energy | $1.89B | $27 |
The underwriters
| Bank | Covers |
|---|---|
| Morgan Stanley | 17 |
| J.P. Morgan | 15 |
| Goldman Sachs | 13 |
| RBC Capital Markets | 13 |
| Jefferies | 12 |
| BofA Securities | 11 |
| Barclays | 10 |
| Stifel | 10 |
| Citigroup | 9 |
| Guggenheim Securities | 9 |
| Evercore ISI | 8 |
| Wolfe | Nomura Alliance | 8 |
Where they listed
| Exchange | Listings |
|---|---|
| Nasdaq | 28 |
| NYSE | 14 |
| NYSE American | 3 |
What they do
| Sector | Listings |
|---|---|
| Industrials | 9 |
| Healthcare | 7 |
| Technology | 6 |
| Financials | 2 |
| Materials | 2 |
| Real Estate | 2 |
| Utilities | 2 |
| Consumer Staples | 1 |
| Not in the scan | 14 |
The Quality Scores
Of the listings with more than 21 sessions, 0 rate Above Average or higher, 1 Average, and 30 Below Average or Poor. 14 listings are not scored yet. A young stock cannot yet pass the checks that need months of history, so a new class scores low by how the score works, not as a verdict on the companies.
Left out: 10 blank-check (SPAC) registrations and prospectuses filed in the quarter.
How this report is made
- What counts. Breakaway counts each initial public offering of a company's stock that began trading on Nasdaq, the NYSE, or NYSE American in the quarter, by its first trading day, with no size floor. Blank-check companies (SPACs) and unit offerings are left out and counted; a direct listing is counted apart, and a US listing of a company already listed abroad is counted and marked.
- Other counts. Renaissance Capital counts IPOs and direct listings with a market cap of at least $50 million, and leaves out closed-end funds, unit offerings, and SPACs. IPOScoop counts the IPOs that priced and lists unit offerings apart from its count. Each figure is the outlet's.
- Sources. The offer price, the shares, the total raised, and the underwriters are each company's final prospectus (424B4) on SEC EDGAR, linked on its line; a listing whose prospectus is not read yet takes Massive's IPO calendar's price and raise, and the CSV says which.
- Moves. The first-day move is the first session's close against the offer price; the move since is the price 15 minutes behind against the offer price.
- Banks. The banks are counted once a cover, from the covers read, and the report says how many were read.
- Lock-ups. Each lock-up's last day is from the company's final prospectus, as the prospectus words it: a day it prints, or its count of days from a day it prints or from the first trading day. One that cannot be read from it is marked not read, never estimated. The sales after it are the shares its insiders sold themselves (not grants or options), as filed on Form 4, from that day through the 29 days after; those under a 10b5-1 plan set in advance are counted apart.
- Scores. The sectors and the Quality Scores are Breakaway's. A stock is scored from its second trading day and marked New listing for its first 21 sessions.
Use this report
How to cite
Breakaway, IPOs, Q2 2026, Jul 1, 2026, getbreakaway.com/ipo/report/2026-q2
Journalists: email [email protected] for the data behind this page.