Breakaway is the TrendSpider alternative that scores every chart for you
Breakaway runs 14 chart checks on every US stock and ranks them all, every 15 seconds while the market is open, with no scan to build first.
| TrendSpider | Breakaway(our product) |
|---|---|
| One score for each stock | |
| Yes | |
| Free to use | |
| No | Yes |
| Company numbers in the score | |
| Yes | |
See it live, free until Wednesday morning. No account. No card. Then keep going with a free account.

The top 3 of 3,191 stocks by Quality Score
| Place | Stock | Price | Quality Score |
|---|---|---|---|
| 1 | $117.96 | Exceptional | |
| 2 | $532.60 | Exceptional | |
| 3 | $128.01 | Exceptional |
AMD: 16, Excellent, #166 of 3,191 by Quality Score.
We do the work for you. 3,191 stocks are scored and ranked, every 15 seconds while the market is open. Here it's 15 minutes behind. Pro members see it live.
TrendSpider runs the scans you build. Breakaway scores every stock for you.
Breakaway does one job on every stock: it reads the chart and the company and gives each one a Quality Score.
$0 to see it live
TrendSpider's plans start at $59 a month after a paid first 14 days; Breakaway's ranking is live with no account.
14 checks, lines drawn
The trend, volume, a tight range, and buying are checked on every chart, with support, resistance, and trendlines drawn.
Trades and financials too
Insider and Congress trades, the financials, and the news join the chart, ranked every 15 seconds while the market is open.

The score, added up
No account. No card. Then stay free.
Is Breakaway a stock screener like TrendSpider's scanner?
Breakaway's scanner ranks every stock by Quality Score first, the 14 chart checks already run, so there is no scan to set up.
Scans you build
TrendSpider's plans include scans, strategy-based scans, and scheduled scans that you set up.
Filters for Pro members
Pro members can filter Breakaway's scanner by sector, theme, and score, and save the scan.
A quick first look
For anyone looking at sites like TrendSpider for setups, the ranking is a quick first look, live with no account.
TrendSpider vs Breakaway: how do they compare?
Here is what each site offers, from each one's public pages and app store listings. A check means the site lists it, a cross means its pages say it is not included, and “Not published” means we could not find it on its pages.
| TrendSpider | Breakaway(our product) |
|---|---|
| Core | |
| Core | |
| One score for each stock | |
| Yes | |
| Stock screener | |
| Yes | Yes |
| Real-time prices | |
| Yes | Yes |
| Advanced | |
| Advanced | |
| Trendlines drawn for you | |
| Yes | Yes |
| Chart patterns | |
| Yes | Yes |
| Testing strategies on past prices | |
| Yes | No |
| Trading bots | |
| Yes | No |
| Chart checks done for you | |
| Yes | |
| News and reports | |
| News and reports | |
| Company numbers in the score | |
| Yes | |
| Congress trades | |
| Yes | |
| Alerts | |
| Alerts | |
| Alerts | |
| Yes | Yes |
| Phone | |
| Phone | |
| App in the App Store | |
| Yes | No |
| Price | |
| Price | |
| Free to use | |
| No | Yes |
What does Breakaway cost next to TrendSpider?
TrendSpider
Starting price
$19for 14 days
- TrendSpider has no free plan. Its four plans start with 14 days for $19 to $49.
- After that, Standard is $59 to $89 a month, Premium $99 to $149, Enhanced $133 to $199, and Advanced $233 to $349, with up to 28% off the first year when billed yearly.
- Every plan has every feature. The plans differ in limits like alerts, bots, and scans.
Even the first look costs $19.
Breakaway (our product)
Starting price
$0a month
See it live, free until Wednesday morning. No account. No card. Then keep going with a free account.
Pro is $29 a month, or $20.75 a month billed yearly ($249 a year). Live prices, every stock ranked, filters, saved scans, and optional alerts.
What does Breakaway show you?
Four things Breakaway works out from the chart and the company for you.
See how Breakaway reads AMD, free, no account.
See AMD's 14 chart checksSee it live, free until Wednesday morning. No account. No card. Then keep going with a free account.
Stay with TrendSpider if you write and test your own rules
TrendSpider gives every plan every feature, and its plans differ only in limits.
Trendlines and Fibonacci, automated
It draws trendlines and Fibonacci levels for you and recognizes chart patterns.
Strategy testing with AI
It tests strategies on past prices, runs scheduled scans, and runs trading bots.
Real-time data, free
Real-time US stock data is free for non-professional users.
How to switch to Breakaway
Tap the green button
You are in right away, with no account to make, no card, no address, and nothing to cancel.
Star the stocks you own
Your watchlist keeps them, sorted by Quality Score, with optional alerts if you want them.
Keep going free
A free account keeps your watchlist, and you choose Pro only if you want live prices and every stock ranked.
Who is Breakaway for?
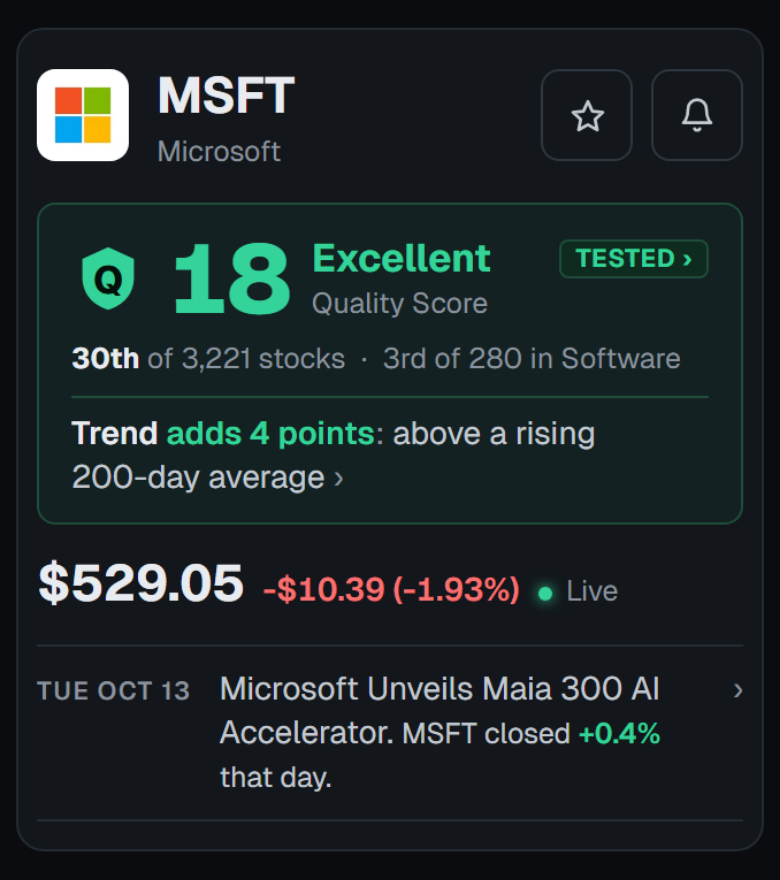
You own a few stocks
See each stock you own with its score, its rank, and what moved it. Keep them on a free watchlist.
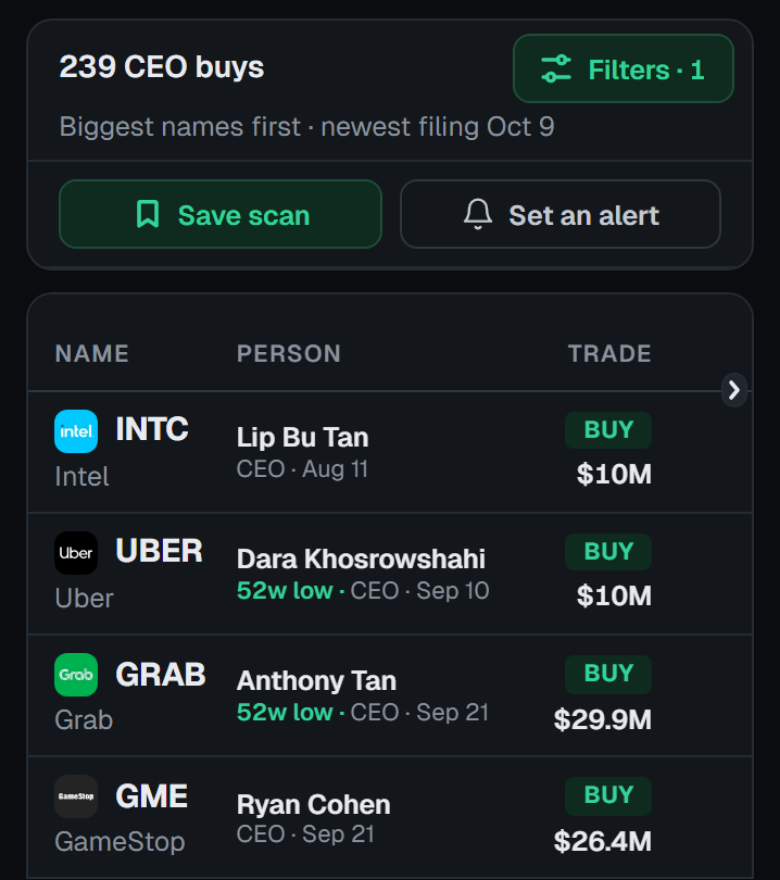
You follow small companies
See who inside the company is buying, and how much cash it has against its next FDA date.
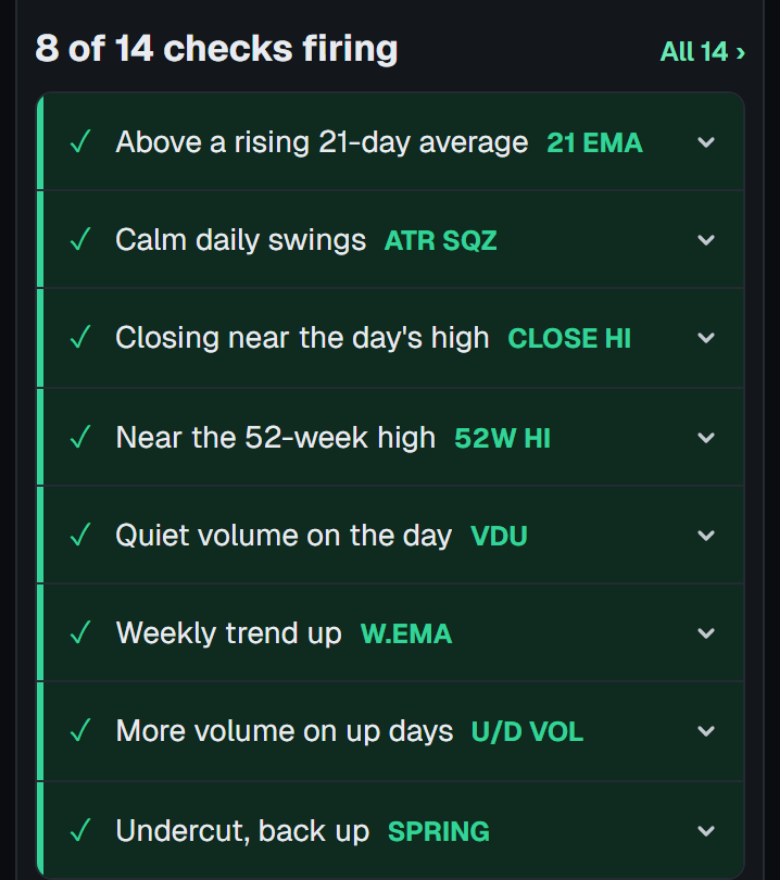
You trade
Every stock is already ranked, each with 14 chart checks and the reasons.


What Breakaway covers
- 3,191 US stocks, ADRs included, each scored every 15 seconds while the market is open.
- Insider trades reported to the SEC, and Congress trades from the House and Senate disclosure sites.
- Sales, profits, and cash from each company's reports, read into the score.
- FDA decision dates for drug makers, with each company's cash against the date.
- US stocks only: no ETFs, options, or crypto coins.
Your questions about a TrendSpider alternative
Is there a free version of TrendSpider?
TrendSpider's pricing page lists no free plan. Its plans start with 14 days for $19 to $49, then run from $59 to $349 a month. Its page says every plan includes every feature, from automated trendlines to strategy testing and trading bots, and the plans differ in limits.
Is there a free TrendSpider alternative?
Yes. You can see Breakaway live with no account and no card, then keep going with a free account. Breakaway runs a fixed set of chart checks for you, and Pro is $29 a month.
Does Breakaway draw trendlines automatically like TrendSpider?
Yes. Every stock's chart can show support, resistance, and trendlines drawn for you, with triangles, channels, and wedges named where they form. TrendSpider lists automated trendlines, Fibonacci levels, and pattern recognition among its features.
Does Breakaway have a stock screener like TrendSpider's scanner?
Yes. The scanner ranks every stock by its Quality Score with the chart checks already run. Pro members can filter it and save scans. TrendSpider's scans are ones you build.
Can I test a strategy on past prices with Breakaway?
No. Breakaway does not run your own rules over past prices. It publishes how its Quality Score was tested on 20 years of market data, and TrendSpider is made for testing strategies you write.
Is TrendSpider data real-time?
TrendSpider's pricing page lists real-time US stock and ETF data free for non-professional users and $29 a month for professionals. Breakaway shows live prices to Pro members and guest passes, and its public pages are 15 minutes behind.
The chart, read for you. Check any stock, free, in one tap.
See all 3,191 stocks rankedSee it live, free until Wednesday morning. No account. No card. Then keep going with a free account.
Also compared: Stock Rover, Finviz, Koyfin, and Zacks. Every comparison