13 momentum traits, checked every 15 seconds. Done for you.
Thirteen chart checks, run on 2,500 stocks every 15 seconds. All 13 are named below.
7 days free. No card. Cancel in two clicks.
After hours, from the scanner
Closed at 4:00 PM ET. As of 4:34 PM ET, delayed 15 minutes, 2,570 stocks scannedThe stocks with the most traits firing, then a few with fewer
13 traits checked on 2,570 stocks, every 15 seconds while the market is open
The Quality Score adds the momentum traits to the long-term trend, size, profit, and the filings, one number per stock.
CLBKColumbia Financial, Inc.10/13 traits+0.26%
Trend4/5Participation2/3Compression2/3Accumulation2/3HALOHalozyme Therapeutics, Inc.10/13 traits+2.53%
Trend5/5Participation2/3Compression1/3Accumulation2/3VLOValero Energy Corporation10/13 traits+0.18%
Trend5/5Participation2/3Compression2/3Accumulation1/3AMDAdvanced Micro Devices9/13 traits+2.70%
Trend5/5Participation1/3Compression1/3Accumulation2/3TMOThermo Fisher Scientific, Inc.7/13 traits-1.04%
Trend4/5Participation2/3Compression1/3Accumulation0/3KNSAKiniksa Pharmaceuticals International, plc5/13 traits-2.63%
Trend1/5Participation2/3Compression2/3Accumulation0/3FIVNFive9, Inc.3/13 traits-5.88%
Trend2/5Participation1/3Compression0/3Accumulation0/3FTITechnipFMC plc1/13 traits-0.99%
Trend0/5Participation1/3Compression0/3Accumulation0/3
Also in the same account: Congress trades · Insider buys · Quality Score · Optional alerts · Market map · Unusual volume · Earnings reactions · Who reports next · The whole thing on your phone
Here are all 13.
Every one is checked the same way on every stock, every 15 seconds. You never have to run one yourself.
- The moving averages stacked in order, 8 over 21 over 50 over 200
- Holding above a rising 21-day line
- The weekly chart agreeing with the daily
- A higher high and a higher low than the session before
- Within 5% of its 52-week high
- Volume at least 1.5 times its 20-day average
- Volume dried up under 0.7 times average while it rests
- More volume on up days than down days over 50 sessions
- The daily range in the tightest quarter of its own year
- Bollinger Bands squeezed inside the Keltner Channels
- The narrowest range of the last seven sessions
- On-balance volume at a 20-day high
- Closing in the top third of the day's range
- Undercut the 10-day low and closed back above it
Heavy volume and dried-up volume are opposites, so 13 is the most a stock can show at once.

Four groups, one card
Trend: the moving averages stacked and rising. Participation: volume expanding or drying up. Compression: a squeeze forming. Accumulation: on-balance volume at a high, closes near the top of the bar. Each group is a meter with its count.
The same rule on every stock
Every trait is checked against the same definition on every stock, every 15 seconds, so the count means the same thing on every stock. Seven or more is uncommon. Nine or more is rare.
The score builds on it
The trait count is the start. The Quality Score adds the long-term trend, company size, profit from the filing, news, insider trades, and government trades, and prints every point with its reason.

Seven days free. No card.
See every check on every stockThe traits are just one tab.
You came for the traits. The same account opens all of these. Every picture below is a real screen from the account.
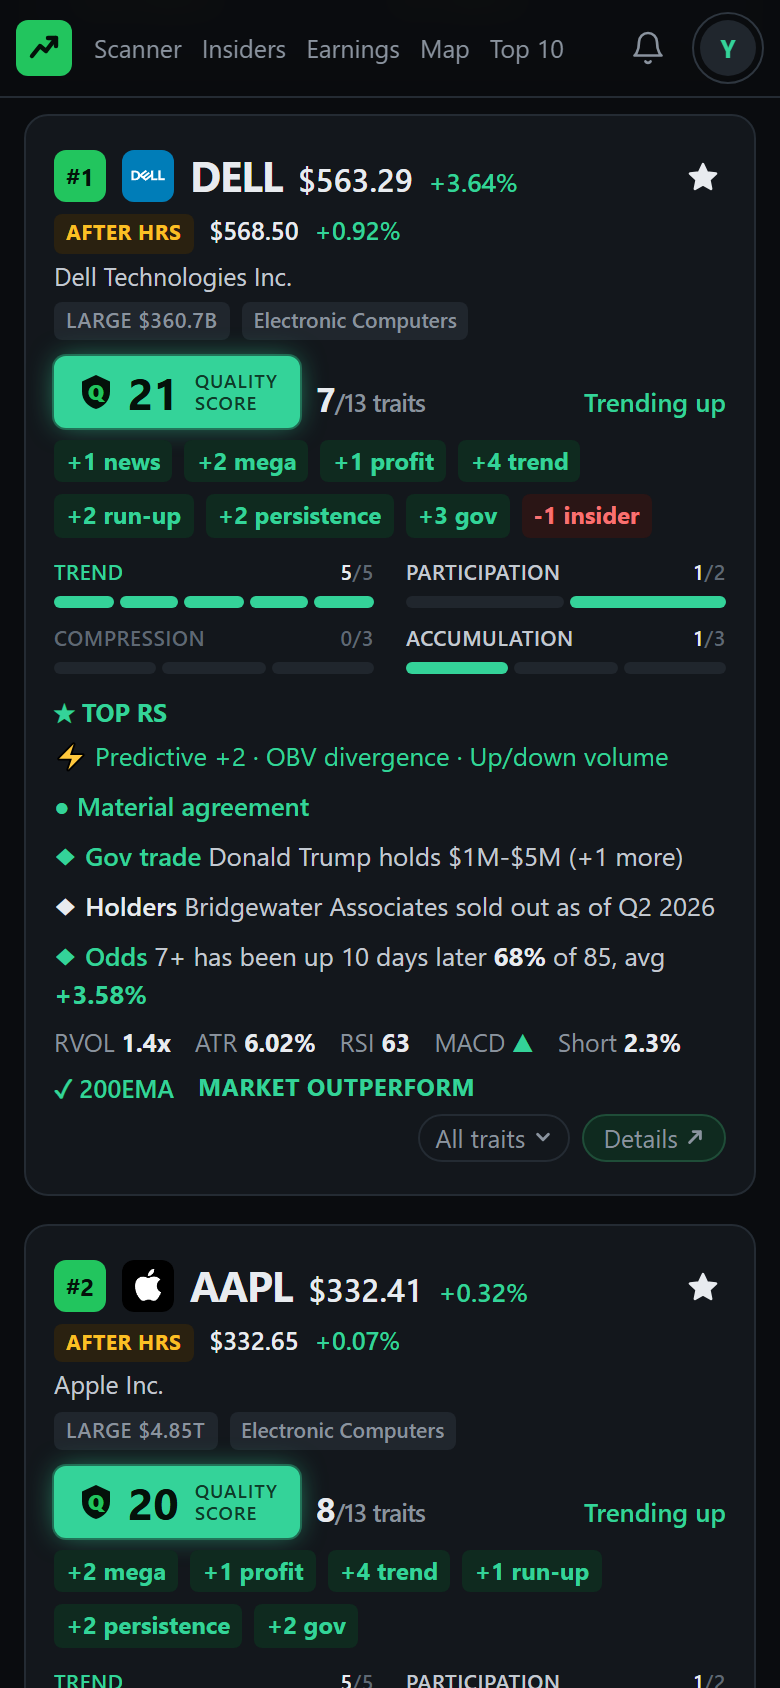 The scanner
Every stock ranked by Quality Score, rescored every 15 seconds while the market is open.
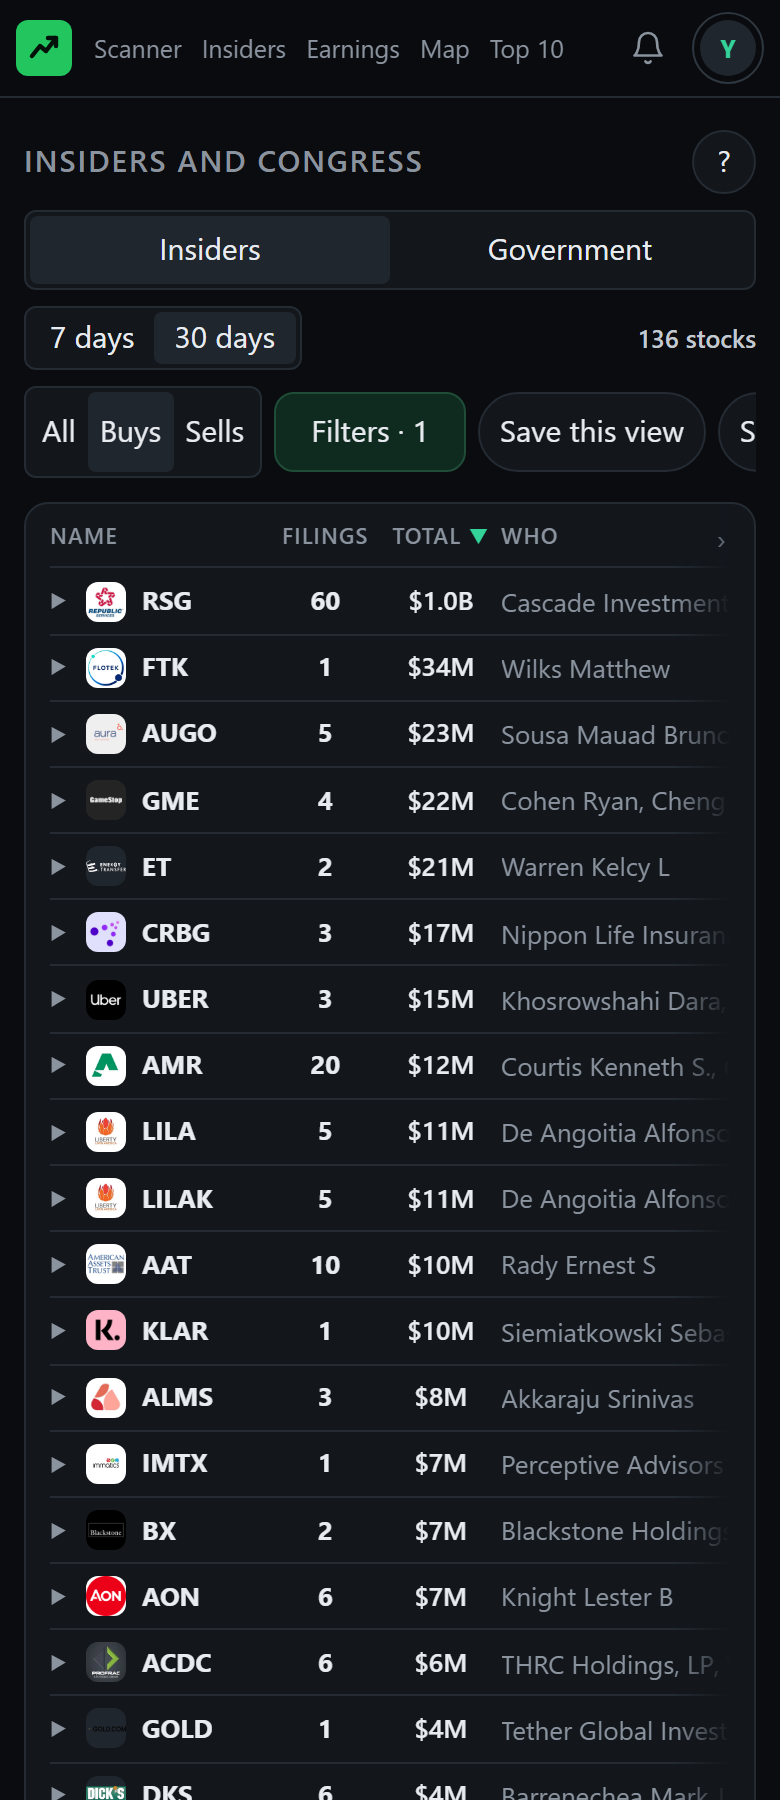 Insiders and Congress
Insider buys, Congress trades, and 8-K filings, the day they hit EDGAR.
 Earnings
How the stock moved the last four times it reported, and who reports next.
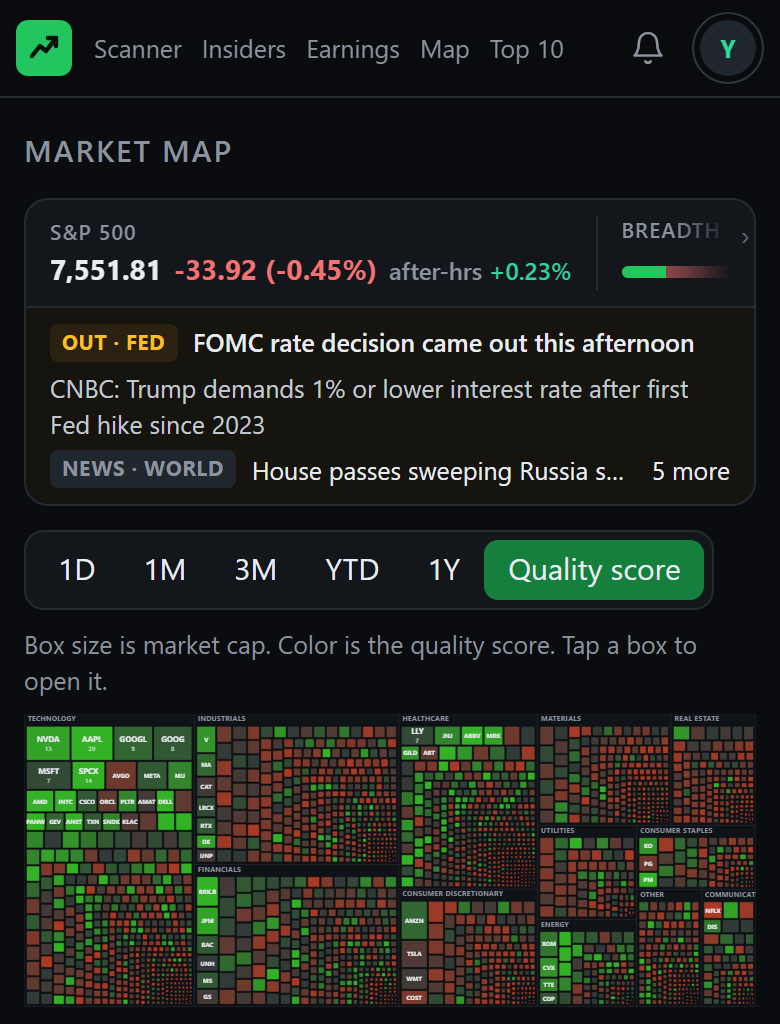 The map
Every sector on one screen. Color it by the move over a day, a month, or a year, or by Quality Score.
 Movers
The biggest movers in the whole market, from 4 AM through the close.
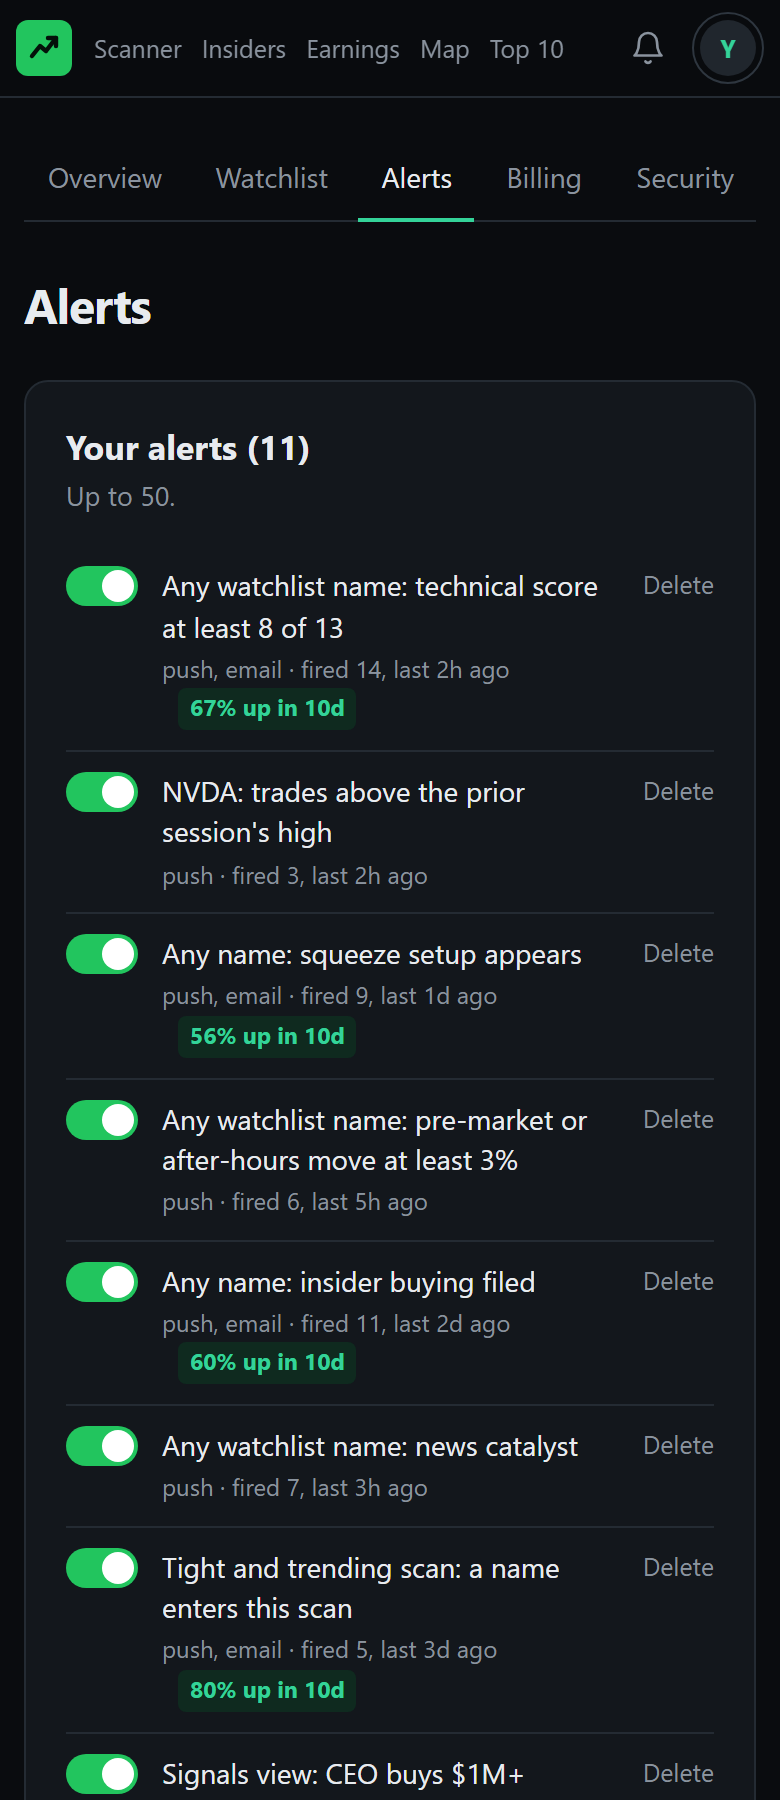 Alerts
Optional. A push or an email when something you picked happens. Off until you turn one on.


2,570 stocks scored631 Form 4s read this week22 Congress filings this week166 earnings reports read this month21 optional alert rules
One plan, $29 a month. Seven days free, no card.
Straight Answers
How does the free trial work?
Seven days, no card. Sign up with your email and you are in; the trial starts that moment, and confirming the address turns on alerts by email and receipts. Everything in the plan is open for the seven days. When it ends the scanner locks until you subscribe, and your watchlist, alerts, and saved scans are kept and come back the moment you do. One trial per person, so a second email or a second device does not start another.
What does it cost?
One plan with everything in it: $29 a month, $69 for three months or $249 a year. The first 100 yearly members pay $199 a year and keep that price. You pick the billing period when the trial ends, and payments go through Stripe, so Breakaway never sees your card.
Can I cancel?
Yes, from the billing page in your dashboard, in two clicks. You keep access until the end of the period you paid for.
Where does the data come from?
Daily bars, quotes, reference data, headlines, and short interest come from Massive, formerly Polygon, a licensed market data vendor. The age of the quotes is shown at the top of every page. Insider trades, notable holders and profits come straight from the SEC. That means Form 4 filings, 13F filings and XBRL financial data on EDGAR. Government trades come from the public STOCK Act and Office of Government Ethics filings. The market-wide headlines on the market line also come from the public headline feeds CNBC, MarketWatch and Yahoo Finance publish, shown as the headline, the source and a link to the article. Splits, dividends, and the financial statements on each ticker page come from the vendor's reference data. The 8-K filings on EDGAR are read for the items that move a price. Five years of history is loaded for every stock. So the 200-day and 52-week traits and the setup odds rest on real history. Options flow is not part of the product.
Does it work on a phone?
Yes, and it works well. Breakaway was designed for a phone screen first. You get one column of cards. The movers and your watchlist are strips you swipe. The map's tables scroll sideways. Every control sits within reach of a thumb. Alerts arrive as push notifications on the phone itself. On an iPhone, add Breakaway to your Home Screen first and push notifications work from there. The whole ticker page works one-handed, chart and trade plan included. Nothing overflows and nothing needs pinching.
Is this investment advice?
No. It is a screening tool that ranks technical and news conditions. It does not know your situation and it is not a recommendation to buy or sell anything. Please do your own research.
See what is ranking right now.
Seven days of the full scanner. No card. The whole thing opens the moment you sign up.
A screening tool for momentum traders. It ranks technical and news conditions. It is not investment advice, and nothing here is a recommendation to buy or sell any security.